(Standard disclaimer about how I understand that this is not of interest to the usual regular or irregular reader of this blog.) Kieran and the mysterious "Steve M" caused me to rethink the eight plots I posted the other day. Kieran was right that what I said about the graphs wasn't consistent with the graphs themselves; instead of changing the graphs, though I've thought more precisely what I said about them. Steve M thought I should think more precisely in terms of the potential outcomes framework, which is what I actually meant to be doing, only I forgot about the "precisely" part. What I think I want to say is characterized by this table:
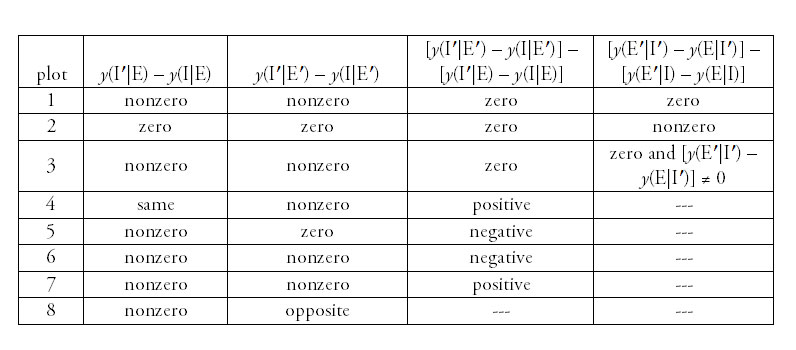
I is the blue line in the graph, I′ is the red line. I is the “natural/default/control” entity (e.g., genotype), and I′ is the “intervened/treated” entity. E is the “natural” environment, and E′ is the “intervened” environment. y is the outcome, so y(I|E) would be the outcome for the "natural" entity in the "natural" environment. "---" in the table means that the answer can vary in ways which would imply that the graph would be drawn differently but I’m taking these variations for purposes here as being minor variations of the same plot.
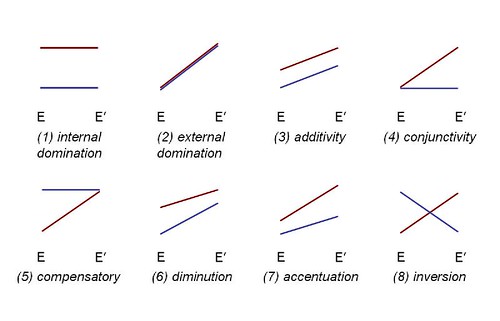
Anyway, the plots themselves may be characterized like this:
(1) the genetic cause has an effect that is the same across the environments and the environmental cause has no effect
(2) the genetic cause has no effect and the environmental cause has an effect that is the same across the genotypes
(3) the genetic cause has an effect that is the same across environments and the environmental cause has an effect that is the same across genotypes
(4) the genetic cause only has an effect if the environmental cause is present
(5) the genetic cause only has an effect if the environmental cause is absent
(6) the genetic cause has an effect that is reduced by the environmental cause
(7) the genetic cause has an effect that is increased by the environmental cause
(8) the genetic cause has an effect that is reversed by the environmental cause
And, because the original point was not so much the eight plots per se as the fact that the figure in stories about genes v. environment, person v. situation, and agency v. structure all as matters of "internal" versus "external" causes, this would be an example of the eight plots using the example of people (given that drunkenness isn't actually a situation, one could substitute "at parties").
(1) A is more outgoing than B, the same whether they are sober or drunk
(2) A isn’t more outgoing than B, but they’re both more outgoing when drunk
(3) A is more outgoing than B. They’re both more outgoing when drunk, to the same degree
(4) A isn’t usually more outgoing than B, but A is way more outgoing when you get them both drunk
(5) A is more outgoing than B, but B gets so much more outgoing when they both get drunk that then they’re about the same
(6) A is more outgoing than B. They’re both more outgoing when they’re drunk, B more than A so they’re more similar
(7) A is more outgoing than B. They’re both more outgoing when they’re drunk, A more than B so they’re even more different
(8) A is more outgoing than B. Unless you get them drunk, then B is more outgoing than A
I think I can name pairs of people who would satisfy all eight of these stories, actually.

No comments:
Post a Comment