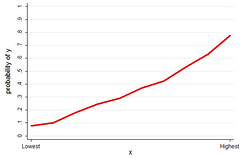
The variable on the x-axis is a uniformly distributed variable, as in say "deciles." The y-axis is the probability of observing the outcome. As you move from the lowest to highest "decile," the probability of observing the outcome increases from less than 10% to almost 80%. By the standards of social science, I would call this a "strong effect." Would you call this a strong effect? Someone, validate me!
I will post about what this graph is actually a graph of when I get a chance. It is not a graph of the probability of my getting on a mechanical bull by the number of vodka-and-cranberry-juices consumed. Guesses welcome, with the usual coveted JFW kewpie doll as prize.

No comments:
Post a Comment